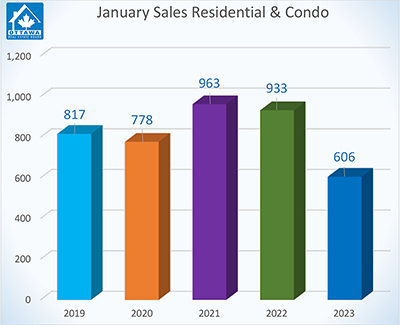
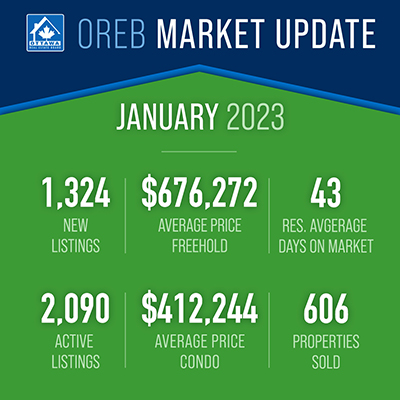
Members of the Ottawa Real Estate Board (OREB) sold 606 residential properties in January through the Board’s Multiple Listing Service® (MLS®) System, compared with 933 in January 2022, a decrease of 35%. January’s sales included 460 in the freehold-property class, down 30% from a year ago, and 146 in the condominium-property category, a decrease of 47% from January 2022. The five-year average for total unit sales in January is 819.
“January’s marked slow down in unit sales over 2022 indicates potential home buyers are taking their time,” says OREB President Ken Dekker. “While last month saw the culmination of the succession of interest rate hikes announced by the Bank of Canada, affordability remains a factor. They may be waiting for a shift in listing prices. They’re being cautious in uncertain conditions.”
 |
By the Numbers – Average Prices*:
- The average sale price for a condominium-class property in January was $412,244, a decrease of 8% from 2022.
- • The average sale price for a freehold-class property was $676,272, decreasing 12% from a year ago.
“Despite the decrease in average prices, the market should not be considered on a downward slide,” says Dekker. “A hyper COVID-19 seller’s market is now leveling out to our current balanced market state.”
“On a positive note, in comparison to December’s figures, January’s average price of freehold properties increased by 3%. The average price of condos did fall by 5% compared to December but condo pricing tends to fluctuate more due to the small data set.”
By the Numbers – Inventory & New Listings:
- Months of Inventory for the freehold-class properties has increased to 3.8 months from 0.9 months in January 2022.
- Months of Inventory for condominium-class properties has increased to 3.8 months from 0.8 months in January 2022.
- January’s new listings (1,324) were 16% higher than 2022 (1,142) and up 89% from December 2022 (699). The 5-year average for new listings in January is 1,233.
“Ottawa’s inventory and days on market figures are typical for a balanced market and another sign that buyers are no longer racing to put in an offer,” says Dekker. “The increase in new listings and supply is a boon for home buyers, who now have more selection and the ability to put in conditions at a less frantic pace. REALTORS® are an essential resource in finding the right property for the right buyer. On the other side of the transaction, REALTORS® can help sellers with hyper-local insights about how to sell in their neighbourhood at a time when pricing is key.”
More people are turning to REALTORS® for help renting properties — 509 this month compared to 410 in January 2022, an increase of 24%. “Even with the increase in housing stock, the tighter rental market is another indication that affordability is keeping some potential buyers on the sidelines.”
* OREB cautions that the average sale price can be useful in establishing trends over time but should not be used as an indicator that specific properties have increased or decreased in value. The calculation of the average sale price is based on the total dollar volume of all properties sold. Price will vary from neighbourhood to neighbourhood.
 |
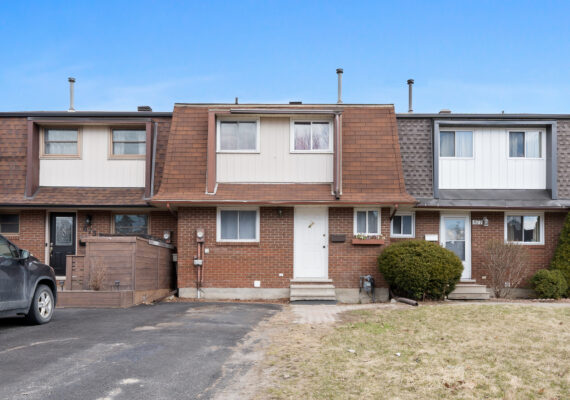
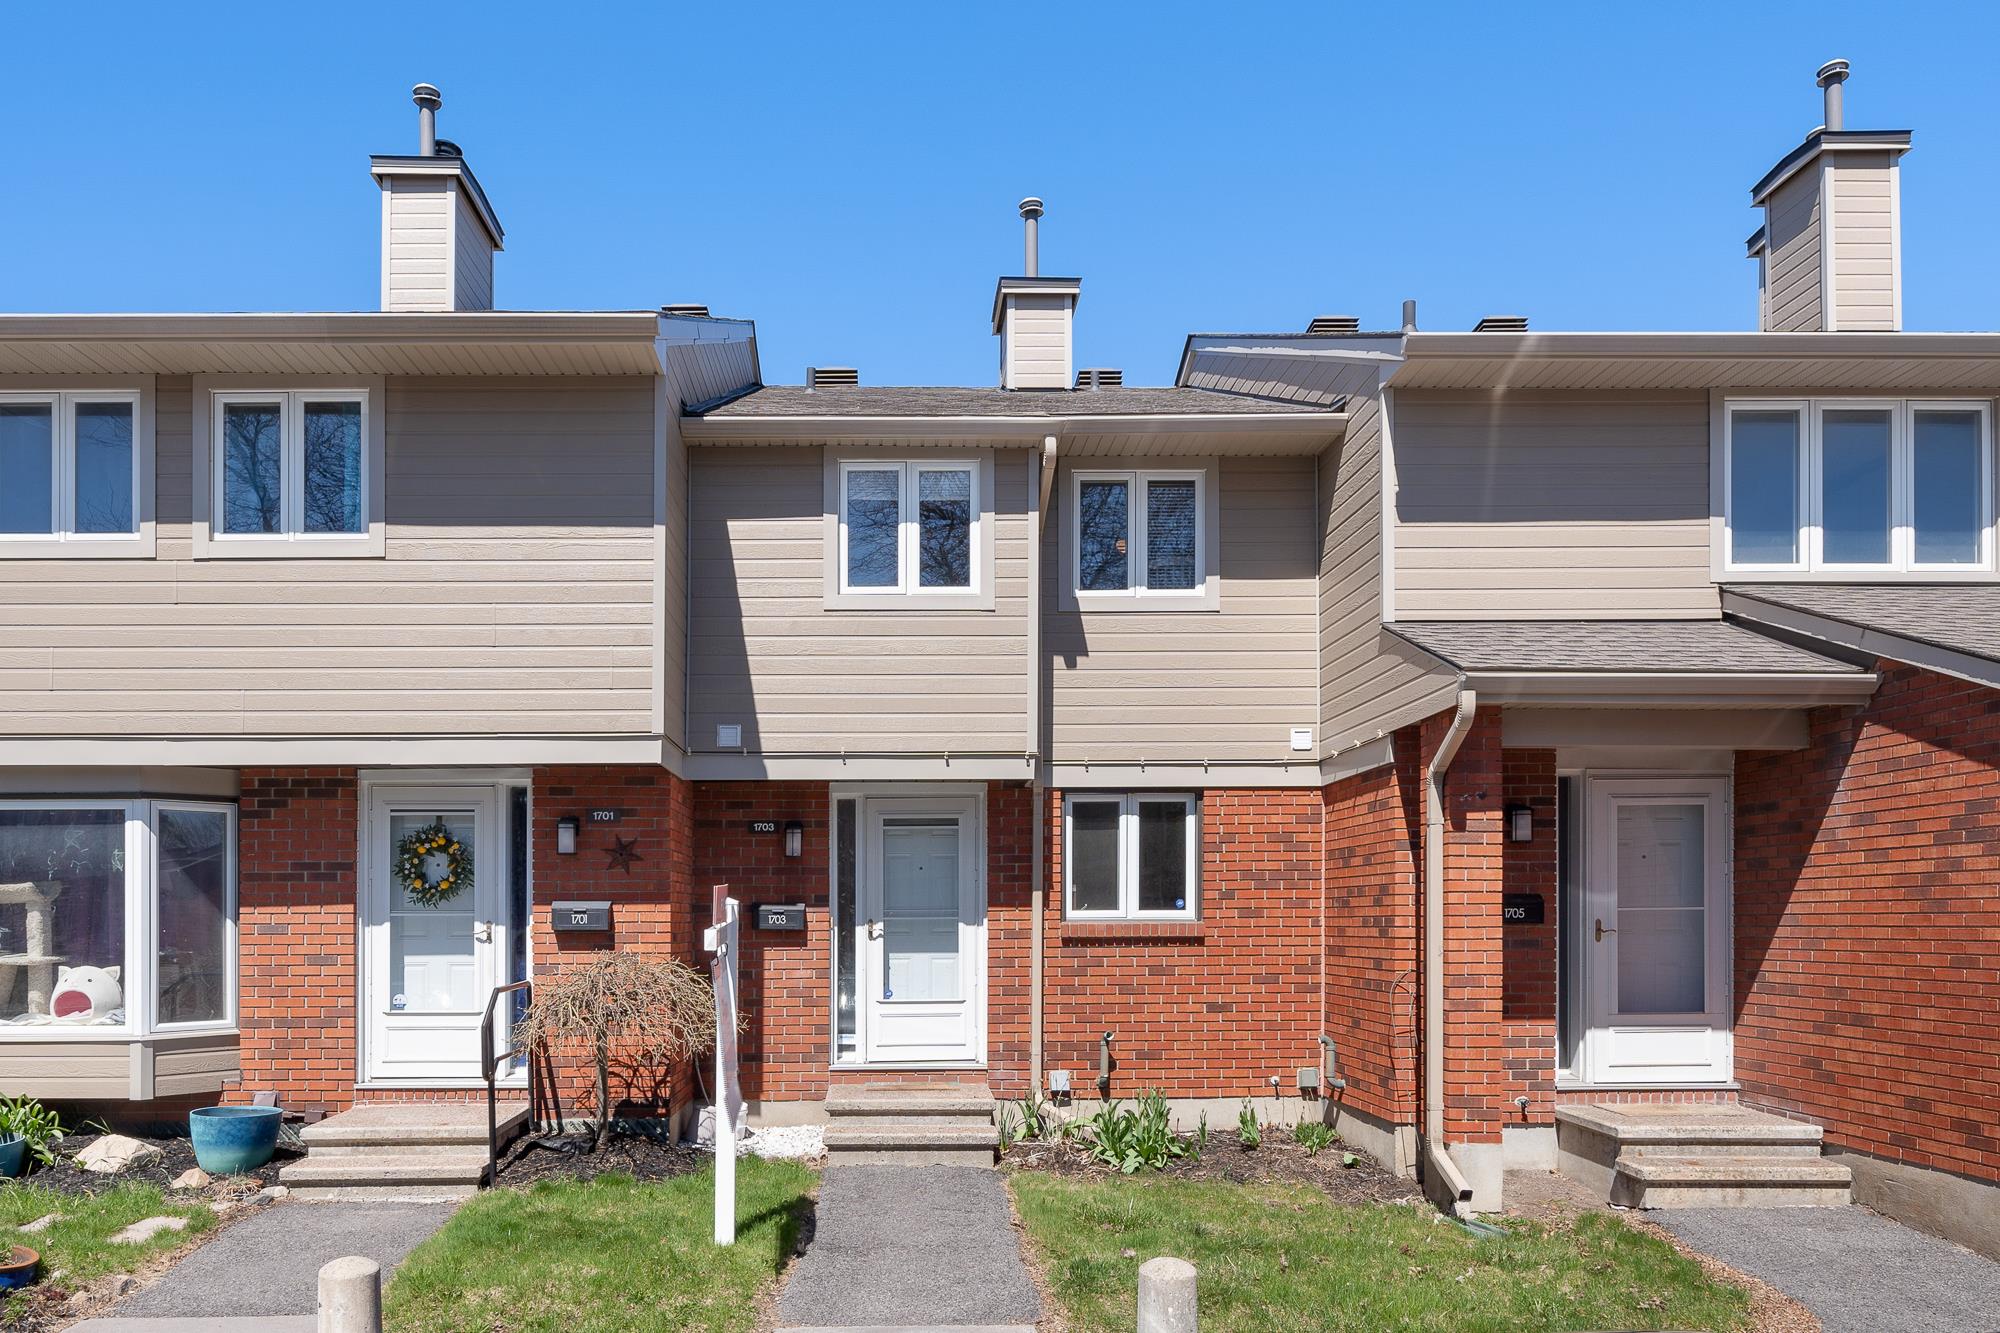
Pilon Real Estate Group Featured Listings: Click here!
We Keep You Covered When You Buy a Home With Our 12 Month Buyer Protection Plan!
Details at: www.HomeBuyerProtectionPlan.ca
Free Home Search With Proprietary MLS Access – New Listings – Faster Updates And More Accurate Data!
Find Homes Now: www.FindOttawaHomesForSale.com
Find Out How We Get Our Sellers More: Click here!
RE/MAX Hallmark ® Pilon Group Realty
www.PilonGroup.com
Email: Info@PilonGroup.com
Direct: 613.909.8100


